


Post provided by Coralie Williams
Conducting a meta-analysis involves a series of decisions, from choosing what data to extract to selecting the outcome measure. But then comes the model specification – how should it be formulated?
At its simplest, a meta-analysis can be expressed as a simple linear regression model where the outcome is an effect size (yi), which is a quantitative measure derived from descriptive or inferential statistics in selected studies:

This basic formulation, similar to a simple linear regression, assumes that the outcomes are independent. But this is rarely the case. A common challenge in choosing a modelling approach for a meta-analysis is accounting for different sources of dependence in the data.
In our recent article in Methods in Ecology and Evolution we assessed different modelling approaches to account for dependence. The idea of our study came from reflecting on meta-analysis modelling choices in our lab (along with co-authors Yefeng Yang and Shinichi Nakagawa; I-PART), and from the results of a recent simulation study by Pustejovsky and Tipton showcasing a new range of working models for fitting meta-analysis with dependent effect sizes.
I wanted to understand how these modelling approaches performed in the context of ecology and evolution meta-analysis, which has the particularly of often including multiple species across studies with evolutionary relationships.
Dependence is common
Dependence is common in ecological and evolutionary datasets.
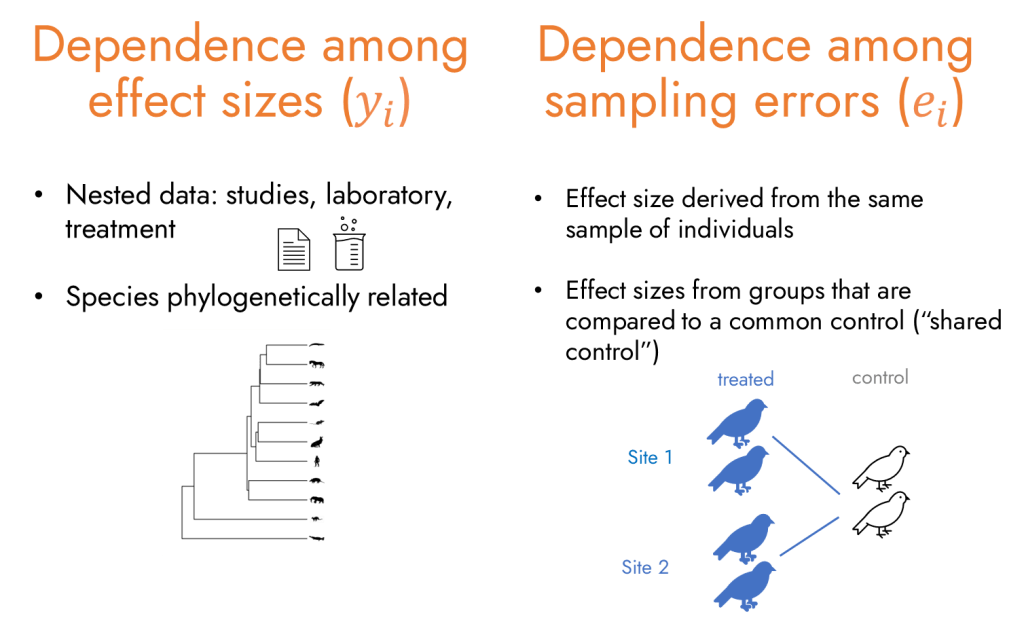
In meta-analyses in particular, effect sizes are usually nested within studies and often shared across multiple species. Broadly, there are two types of dependence structures in meta-analysis: dependence among effect sizes and dependence among sampling errors.
Dependence among effect sizes () arises when multiple effect sizes come from the same hierarchical grouping – for example, the same study, treatment group, location, or from closely related species that share an evolutionary history. Such clustering is frequent in ecology and evolution. In a recent meta-analysisfor instance, 1,007 effect sizes from 125 plant species were derived from just 43 studies, meaning multiple effect sizes were attributed to the same species and the same studies.
Dependence among sampling errors () occurs when an individual or sample contributes to multiple effect sizes. This can happen through repeated measurements, or when multiple treatment groups are compared with the same control group, making the resulting sampling errors non-independent.
Choosing a suitable modeling approach relies on understanding the underlying data structure, but sometimes it is not that straightforward. And, sometimes, the exact source of dependence is unknown or cannot be directly measured, ugh!
New range of working models
We evaluated three modeling approaches in our study:
- Multilevel (i.e. hierarchical) meta-analysis: By adding random effects, we model dependence among effect sizes arising from nested or hierarchical data. This captures clustering in the true effects, but not correlations in the sampling errors.
- Correlated meta-analysis: When primary studies report or imply correlations among sampling errors, we can include this information in the model. This approach directly models dependent errors (sometimes called correlated or multivariate meta-analysis; I have written how confusing these terms are here).
- Cluster-robust variance estimation (CRVE): When the dependence structure is unknown or unreported, cluster robust variance estimation (CRVE; Hedges et al, 2010), a type of sandwich estimator, provides robust standard errors that account for within-cluster dependence without needing to model it explicitly.
Researchers often need to combine these modeling strategies when dependence arises in both effect sizes and sampling errors.
We put this idea to the test by applying the three approaches, individually and in combination, to several model types including fixed effect, random effects, multilevel and phylogenetic models with a species random effect. In our simulation study, we generated generic effect sizes and assumed a constant within study error correlations (φ = 0.2, 0.5, 0.8), noting that real dependence structures are sometimes more complex!
Our findings align with results from previous studies: multilevel models performed best across all scenarios, and CRVE improved coverage when paired with multilevel models, even when the model was misspecified. However, CRVE could not handle crossed structures, such as phylogenetic effects shared across studies, because these fall outside its clustering assumptions.
Finally, when we specified the correct sampling error correlation, we achieved accurate random component estimates (i.e. estimates of heterogeneity).
You can read more about our simulation study results here: “Modeling approaches for meta-analyses with dependent effect sizes in ecology and evolution”.
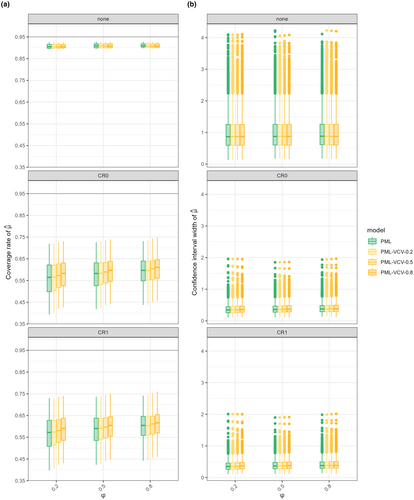
Phylogenetic multilevel models (PML) lose coverage under CRVE because species are spread across studies, not nested within them. CRVE assumes independent clustered data and over-adjusts, reducing coverage. PML without CRVE (“none”) performs more consistently.
So… which modeling approach should you use?
As most statisticians will say: it depends! But here’s a few practical tips for your next meta-analysis:
- Gather as much information as possible from primary studies to understand the data structure.
- Include nested or hierarchical groups as random effects.
- If you know how the data were collected, use that knowledge to inform the sampling error variance–covariance structure. For example, repeated measurements over time may justify an autocorrelation structure, or you may expect correlations to be constant within studies.
- Use CRVE when you are uncertain about model specification. It provides robust variance estimates for fixed effects, but keep its assumptions in mind:
- CRVE requires independent clusters.
- If clusters are not independent (for example, shared phylogenetic effects), one workaround is to fit a simpler model without the crossed random effect and compare estimates for the overall mean as a sensitivity check.
- For small samples or few clusters, use small-sample corrections (e.g. CR2 or CR3).
- When possible, consider registering your model choice in advance.